
Global Process Instrumentation Market Outlook 2025–2035
Market Size and Growth Potential
The global process instrumentation market is projected to reach USD 18.4 billion in 2025 and expand to USD 41.0 billion by 2035, registering a CAGR of 6.8%. This growth is driven by increased adoption of smart instruments, wireless communication systems, and advanced data analytics across industrial sectors. As demand rises, the role of a reliable industrial instruments supplier becomes more critical, supporting companies in upgrading measurement and control systems for higher efficiency and compliance.
Growth Drivers
Process instrumentation enables accurate measurement, early fault detection, and predictive maintenance—helping companies reduce operational costs and boost efficiency. The integration of IoT and Industry 4.0 technologies allows real-time data acquisition, remote monitoring, and optimized process control. These tools also improve regulatory compliance and enhance reliability in critical industries.
Regional Insights
-
North America: A mature market, characterized by heavy investments in automation and regulatory compliance. Industries such as oil & gas, power generation, and manufacturing are upgrading to smart sensors, cloud-enabled instruments, and wireless systems.
-
Europe: Countries like Germany, the UK, and France drive adoption in chemicals, pharmaceuticals, and water treatment. Renewables such as wind and bioenergy are creating new opportunities for digitalized instrumentation.
-
Asia-Pacific: Rapid industrialization in China, India, Japan, and Southeast Asia fuels demand for advanced measurement and control systems. Regulatory requirements on safety and environmental compliance accelerate the adoption of modern instruments.
Challenges and Opportunities
Key Challenges
High implementation costs, complex system integration, and compatibility issues with legacy infrastructure often hinder adoption—particularly for SMEs. Affordable, plug-and-play, and easy-to-calibrate instruments are crucial in overcoming these barriers.
Emerging Opportunities
Automation, smart manufacturing, and digital twin technologies are driving demand for AI-powered sensors, IoT-enabled analyzers, and real-time monitoring systems. Wireless sensors support predictive maintenance, while AI and blockchain offer enhanced data security, autonomous control, and process optimization.
Market Evolution: 2020–2024 vs. 2025–2035
-
2020–2024: Market growth faced headwinds from supply chain disruptions, integration complexity, and high costs. Still, modular instruments, auto-calibration solutions, and AI-enabled systems began gaining ground.
-
2025–2035: The next decade will be shaped by sensor fusion, AI-driven automation, and predictive maintenance. Key innovations include self-learning instruments, wireless protocols, blockchain-secured data, digital twins, and energy-efficient sensors.
Country-Level Outlook
| Country/Region | CAGR (2025–2035) | Key Drivers |
|---|---|---|
| United States | 7.1% | Strong industrial automation, investments in oil & gas, strict EPA/OSHA compliance, AI-integrated sensors |
| United Kingdom | 6.5% | Renewable energy expansion, digital twins, and smart manufacturing growth |
| European Union | 6.7% | Industrial Emissions Directive & Green Deal policies accelerating adoption |
| Japan | 6.6% | High demand from automotive, electronics, and pharmaceuticals; growth in hydrogen energy and smart city projects |
| South Korea | 6.8% | Semiconductor & electronics demand, AI-driven smart factory transformation |
Market Segmentation
-
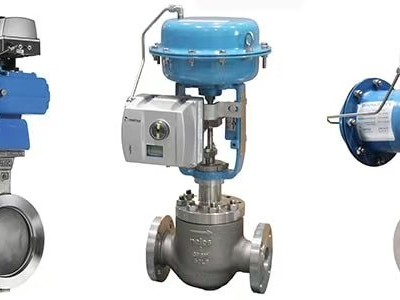
By Instrument Type: Control valves and flow meters dominate due to widespread use in oil & gas, power plants, and water treatment. Smart valves improve response times by up to 50%, while flow meters deliver real-time data for energy and chemical operations.
-
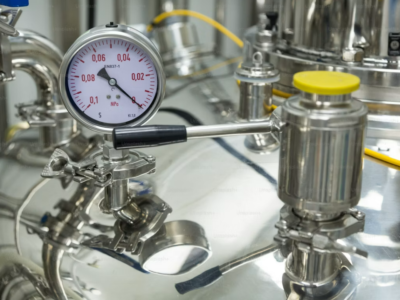
By Application: Oil & gas and chemical sectors remain key adopters. Digital instrumentation has improved oil recovery by nearly 20%, while pipeline operations benefit from smart leak detection and pressure monitoring. In chemicals, continuous monitoring enhances product consistency and safety.
Competitive Landscape
The market features both global automation giants and specialized instrumentation providers:
-
Leading Players:
-
Siemens (15–20% share)
-
ABB (12–16%)
-
Emerson (10–14%)
-
Honeywell (8–12%)
-
Schneider Electric (5–9%)
-
-
Key Highlights:
-
Siemens: Strong in AI-based sensors and smart instruments.
-
ABB: Known for cloud-integrated monitoring and predictive maintenance.
-
Emerson: Reliable solutions across critical industries.
-
Honeywell: Broad automation and IoT portfolio.
-
Schneider: Focus on energy efficiency and real-time analytics.
Other notable players include Yokogawa, Endress+Hauser, GE Digital, Rockwell, and OMEGA Engineering, all contributing to AI-driven, sustainable, and connected instrumentation.
-
Conclusion
From 2025 to 2035, the process instrumentation market will see rapid advancement fueled by automation, intelligence, safety, and sustainability. Regional priorities, sector-specific needs, and technological breakthroughs such as AI, IoT, and digital twins will shape the industry’s trajectory over the next decade. In addition, the availability of specialized instrumentation training services will play a vital role in helping industries adopt these innovations effectively and build a skilled workforce for the future.
 How to Choose the Right Control Valve for High-Pressure Petrochemical Applications
 The Steel Joints of Coal Chemical Industry: A Complete Guide to How Valves & Instruments Govern the Entire Process Flow
 Why Are Valve Positioners So Important?
 5 Common Causes of Inaccurate Level Gauge Readings and On-Site Troubleshooting Methods